
- Bullish: Expanded crushing capacity in Vietnam and strong Chinese demand underpin sustained global soybean meal and oil consumption.
- Bearish: Argentina’s aggressive export surge and record Brazilian shipments intensify competition, pressuring Black Sea soybean margins.
- Neutral to Bearish Black Sea: Mexico’s deepening reliance on U.S. soybeans and Asia’s tilt toward South American origins limit outlet options.
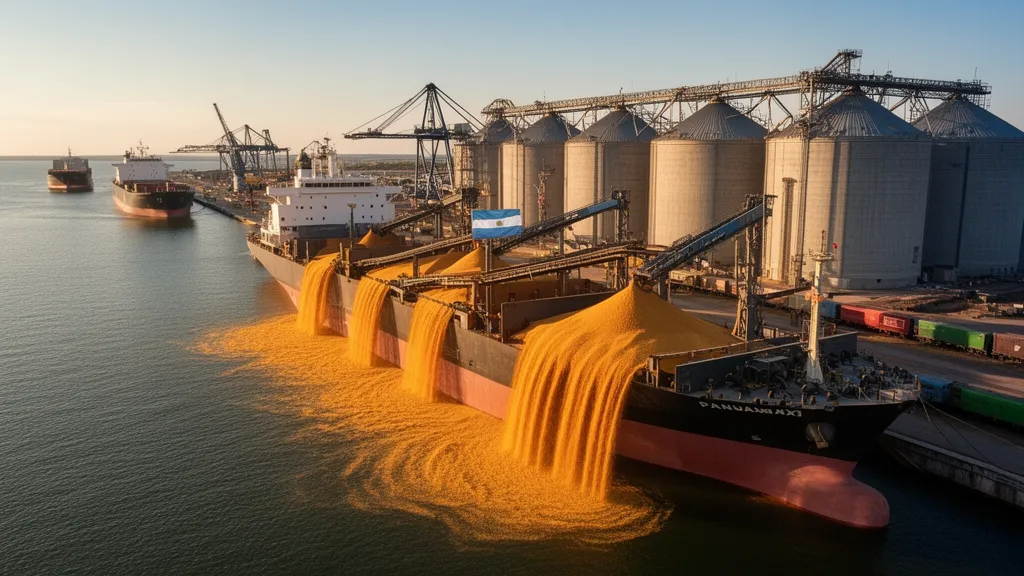
Argentina Floods Global Market with Soybeans
Argentina’s soybean exports surged to 2.2 million tonnes in November 2025, up from 1.69 million tonnes in October and just 96,000 tonnes in November 2024. China absorbed virtually the entire volume at 2.18 million tonnes, equal to 99% of shipments for the month.
From January through November 2025, Argentina shipped 11.51 million tonnes of soybeans, a 150% increase versus 4.6 million tonnes in the same period of 2024. China accounted for 10.7 million tonnes, or 93% of total exports. Preliminary December figures already show at least 1.4 million tonnes shipped exclusively to China, with total 2025 exports projected near 13 million tonnes.
Vietnam Expands Crushing Capacity
In Vietnam, the Bunge-Wilmar joint venture VAL commissioned a second soybean crushing line at Phu My Industrial Park 1, adding 4,000 tonnes per day of capacity. Together with the first line, operational since 2011, total crushing capacity now reaches 7,800 tonnes per day.
The facility is designed to process 2.6 million tonnes of soybeans annually, yielding nearly 2 million tonnes of soybean meal and more than 500,000 tonnes of crude soybean oil. On-site logistics are supported by eight storage silos with total capacity of 120,000 tonnes, positioning Vietnam to cover around 30% of its domestic soybean meal demand from local crushing.
Mexico Strengthens U.S. Supply Links
Mexico has emerged as the United States’ largest agricultural export market in the 2024/25 marketing year. U.S. soybeans now hold an estimated 80% share of Mexico’s soybean imports, reinforcing the country’s status as a core outlet for U.S. origin.
Total U.S. agricultural exports to Mexico surpassed $30 billion in 2024, up 7% year-on-year. In parallel, Brazil exported a record 104.79 million tonnes of soybeans between January and November 2025, underscoring South America’s dominance in global soybean trade flows.
Key Volume and Capacity Metrics
| Item | Region / Facility | Period / Capacity | Volume / Share |
|---|---|---|---|
| Monthly soybean exports | Argentina | Nov 2025 | 2.2 million tonnes (2.18 million to China) |
| Monthly soybean exports | Argentina | Oct 2025 | 1.69 million tonnes |
| Monthly soybean exports | Argentina | Nov 2024 | 96,000 tonnes |
| Jan–Nov soybean exports | Argentina | 2025 | 11.51 million tonnes (+150% y/y) |
| Chinese share of exports | Argentina | Jan–Nov 2025 | 10.7 million tonnes (93% of total) |
| Preliminary Dec shipments to China | Argentina | Dec 2025 | ≥1.4 million tonnes |
| Projected full-year soybean exports | Argentina | 2025 | 13 million tonnes |
| Daily crushing capacity | VAL (Vietnam) | Line 2 only | 4,000 tonnes/day |
| Total daily crushing capacity | VAL (Vietnam) | Lines 1 & 2 | 7,800 tonnes/day |
| Annual soybean throughput | VAL (Vietnam) | Full capacity | 2.6 million tonnes/year |
| Annual soybean meal output | VAL (Vietnam) | Full capacity | ~2 million tonnes/year |
| Annual crude soybean oil output | VAL (Vietnam) | Full capacity | >500,000 tonnes/year |
| Storage capacity | VAL (Vietnam) | On-site silos | 120,000 tonnes |
| U.S. agricultural exports | United States → Mexico | 2024 | >$30 billion (+7% y/y) |
| U.S. soybean market share | Mexico | 2024/25 | 80% of soybean imports |
| Soybean exports | Brazil | Jan–Nov 2025 | 104.79 million tonnes |
Implications for Black Sea Origins
The sharp increase in Argentine exports, combined with Brazil’s record volumes, intensifies competition in China and other key demand centers. With Vietnam scaling up domestic crushing and Mexico leaning more heavily on U.S. soybeans, Black Sea exporters face shrinking access to premium Asian and Latin American outlets.
These shifts are neutral to bearish for Black Sea origins: larger South American supply, entrenched U.S.–Mexico trade, and rising regional processing capacity in Asia all point to thinner margins and heightened price competition in remaining third-country markets.
Source: Market Data
Leave a Reply