
- Bearish freight flows: Ukrainian grain exports are down 24.9% year-on-year to 21.2 million tonnes, signaling weaker cargo availability from Black Sea origins.
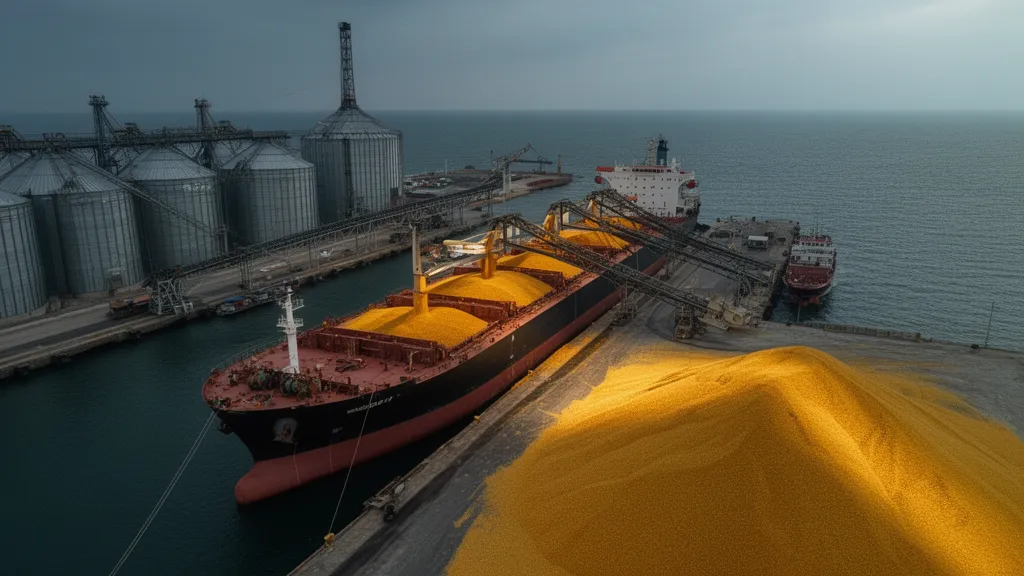
- Corn-driven demand: Corn makes up over half of Ukraine’s exports at 10.7 million tonnes, sustaining Panamax and Supramax employment despite overall volume declines.
- Regional rebalancing: Kazakhstan’s 18.5% export surge to 6.4 million tonnes shifts more grain into Central Asia, with limited overlap with Ukrainian Black Sea routes.
- Supportive basis, softer freight: Lower Ukrainian export volumes may underpin grain basis levels but reduce overall freight market liquidity and pressure vessel rates lower.
Ukraine Grain Export Performance
Ukraine’s grain and leguminous exports reached 21.195 million tonnes as of February 20 in the 2025/26 marketing year, sharply below the 28.219 million tonnes shipped by February 21, 2024. This 7.024 million tonne, or 24.9%, year-on-year decline reflects a materially weaker export program from Black Sea ports and inland logistics channels.
February shipments have also slowed, with 2.287 million tonnes exported through February 20 versus 2.528 million tonnes during the same period last season. The softer pace underscores subdued freight demand and a more selective loading program across key terminals.
| Metric | 2025/26 | 2024/25 (prior season) | Change |
|---|---|---|---|
| Total grain exports by Feb 20/21 (million tonnes) | 21.195 | 28.219 | -7.024 (-24.9%) |
| February exports to Feb 20 (million tonnes) | 2.287 | 2.528 | -0.241 |
Ukraine Export Mix by Commodity
The current export mix is heavily skewed toward corn, which dominates volumes and shapes freight demand profiles. Wheat and barley shipments remain moderate, while rye and flour exports are negligible in volume terms.
| Commodity | Season-to-date exports (million tonnes) | February exports (million tonnes) | Share of total exports (%) |
|---|---|---|---|
| Corn | 10.723 | 1.942 | 50.6 |
| Wheat | 8.816 | 0.328 | 41.6 |
| Barley | 1.350 | 0.015 | 6.4 |
| Rye | 0.0002 | 0.000 | <0.1 |
| Flour (thousand tonnes) | 0.0418 | 0.003 | n/a |
Corn’s 50.6% share of total exports underpins continued Panamax and Supramax employment on longer-haul routes, even as aggregate Ukrainian volumes decline. In contrast, muted wheat and barley flows imply less competition on traditional grain routes into MENA and Asian destinations, potentially opening space for competing origins such as Russia, EU, and Australia.
Kazakhstan’s Regional Export Surge
Kazakhstan exported 6.4 million tonnes of grain between September 2025 and February 19, up 18.5% from 5.4 million tonnes in the same period of 2024/25. Growth is concentrated in Central Asian demand centers, with Uzbekistan, Kyrgyzstan, and Afghanistan all sharply increasing imports.
| Destination | Exports (million tonnes) | Year-on-year change (%) |
|---|---|---|
| Uzbekistan | 3.000 | +46 |
| Kyrgyzstan | 0.180 | +70 |
| Afghanistan | 0.466 | +97 |
This regional pivot channels more Kazakh grain into overland and short-sea routes serving Central Asia, with only limited overlap with traditional Black Sea export corridors. As a result, Kazakhstan’s strength does little to offset the decline in Ukrainian cargoes available to the international deep-sea freight market.
Freight and Basis Market Implications
The roughly 25% shortfall in Ukrainian exports points to weaker overall demand for tonnage from Black Sea origins. With fewer cargoes to fix, vessel owners may face softer rates, particularly on routes historically anchored by Ukrainian wheat and barley flows. Corn-heavy exports still generate Panamax and Supramax activity, but not enough to fully compensate for the lost volume.
For physical grain markets, reduced Ukrainian availability can be supportive for basis levels as importers compete for a smaller pool of exportable supply. However, the simultaneous strength from Kazakhstan into Central Asia indicates that regional consumers retain access to alternative origins, limiting upside for freight in overlapping hinterlands while fragmenting liquidity across distinct corridors.
Source: Market Data
Leave a Reply